Why Marketing Leaders Need to Measure GTM Efficiency to See Where Their Budget Is Working, and Where It’s Bloated

How B2B CMOs use Cost of Growth to measure GTM efficiency, the most financially defensible way to tie marketing spend to business performance.


Every marketing leader eventually gets asked the same question: is the spend working? And that question is getting louder. Boards care about value creation more than ever, leadership teams are under pressure to cut GTM bloat, and more of what marketing spends on is getting harder to trace. Being able to answer it with real numbers is what protects your budget, the programs you know are working, and your credibility with the CFO and the board.

The number that answers it is Cost of Growth, and it's one marketing rarely calculates for itself.

Cost of Growth is typically calculated across all of your go-to-market investments in sales and marketing, but you can also run it for marketing alone, and even then it will give you a better read on your spend than CAC, LTV to CAC, ROI, ROAS, cost per MQL or marketing-sourced pipeline ratio. That makes marketing a great place to start before taking on the full picture. This article explains how it works and why it's far superior to—and more informative than—the financial metrics most marketing teams use today.

What Cost of Growth is

Cost of Growth is how much you spend on sales and marketing to add $1 of net new annual recurring revenue (ARR). You'll often hear it used interchangeably with GTM Efficiency, because that's exactly what it measures: how efficiently your go-to-market spend is turning into growth.

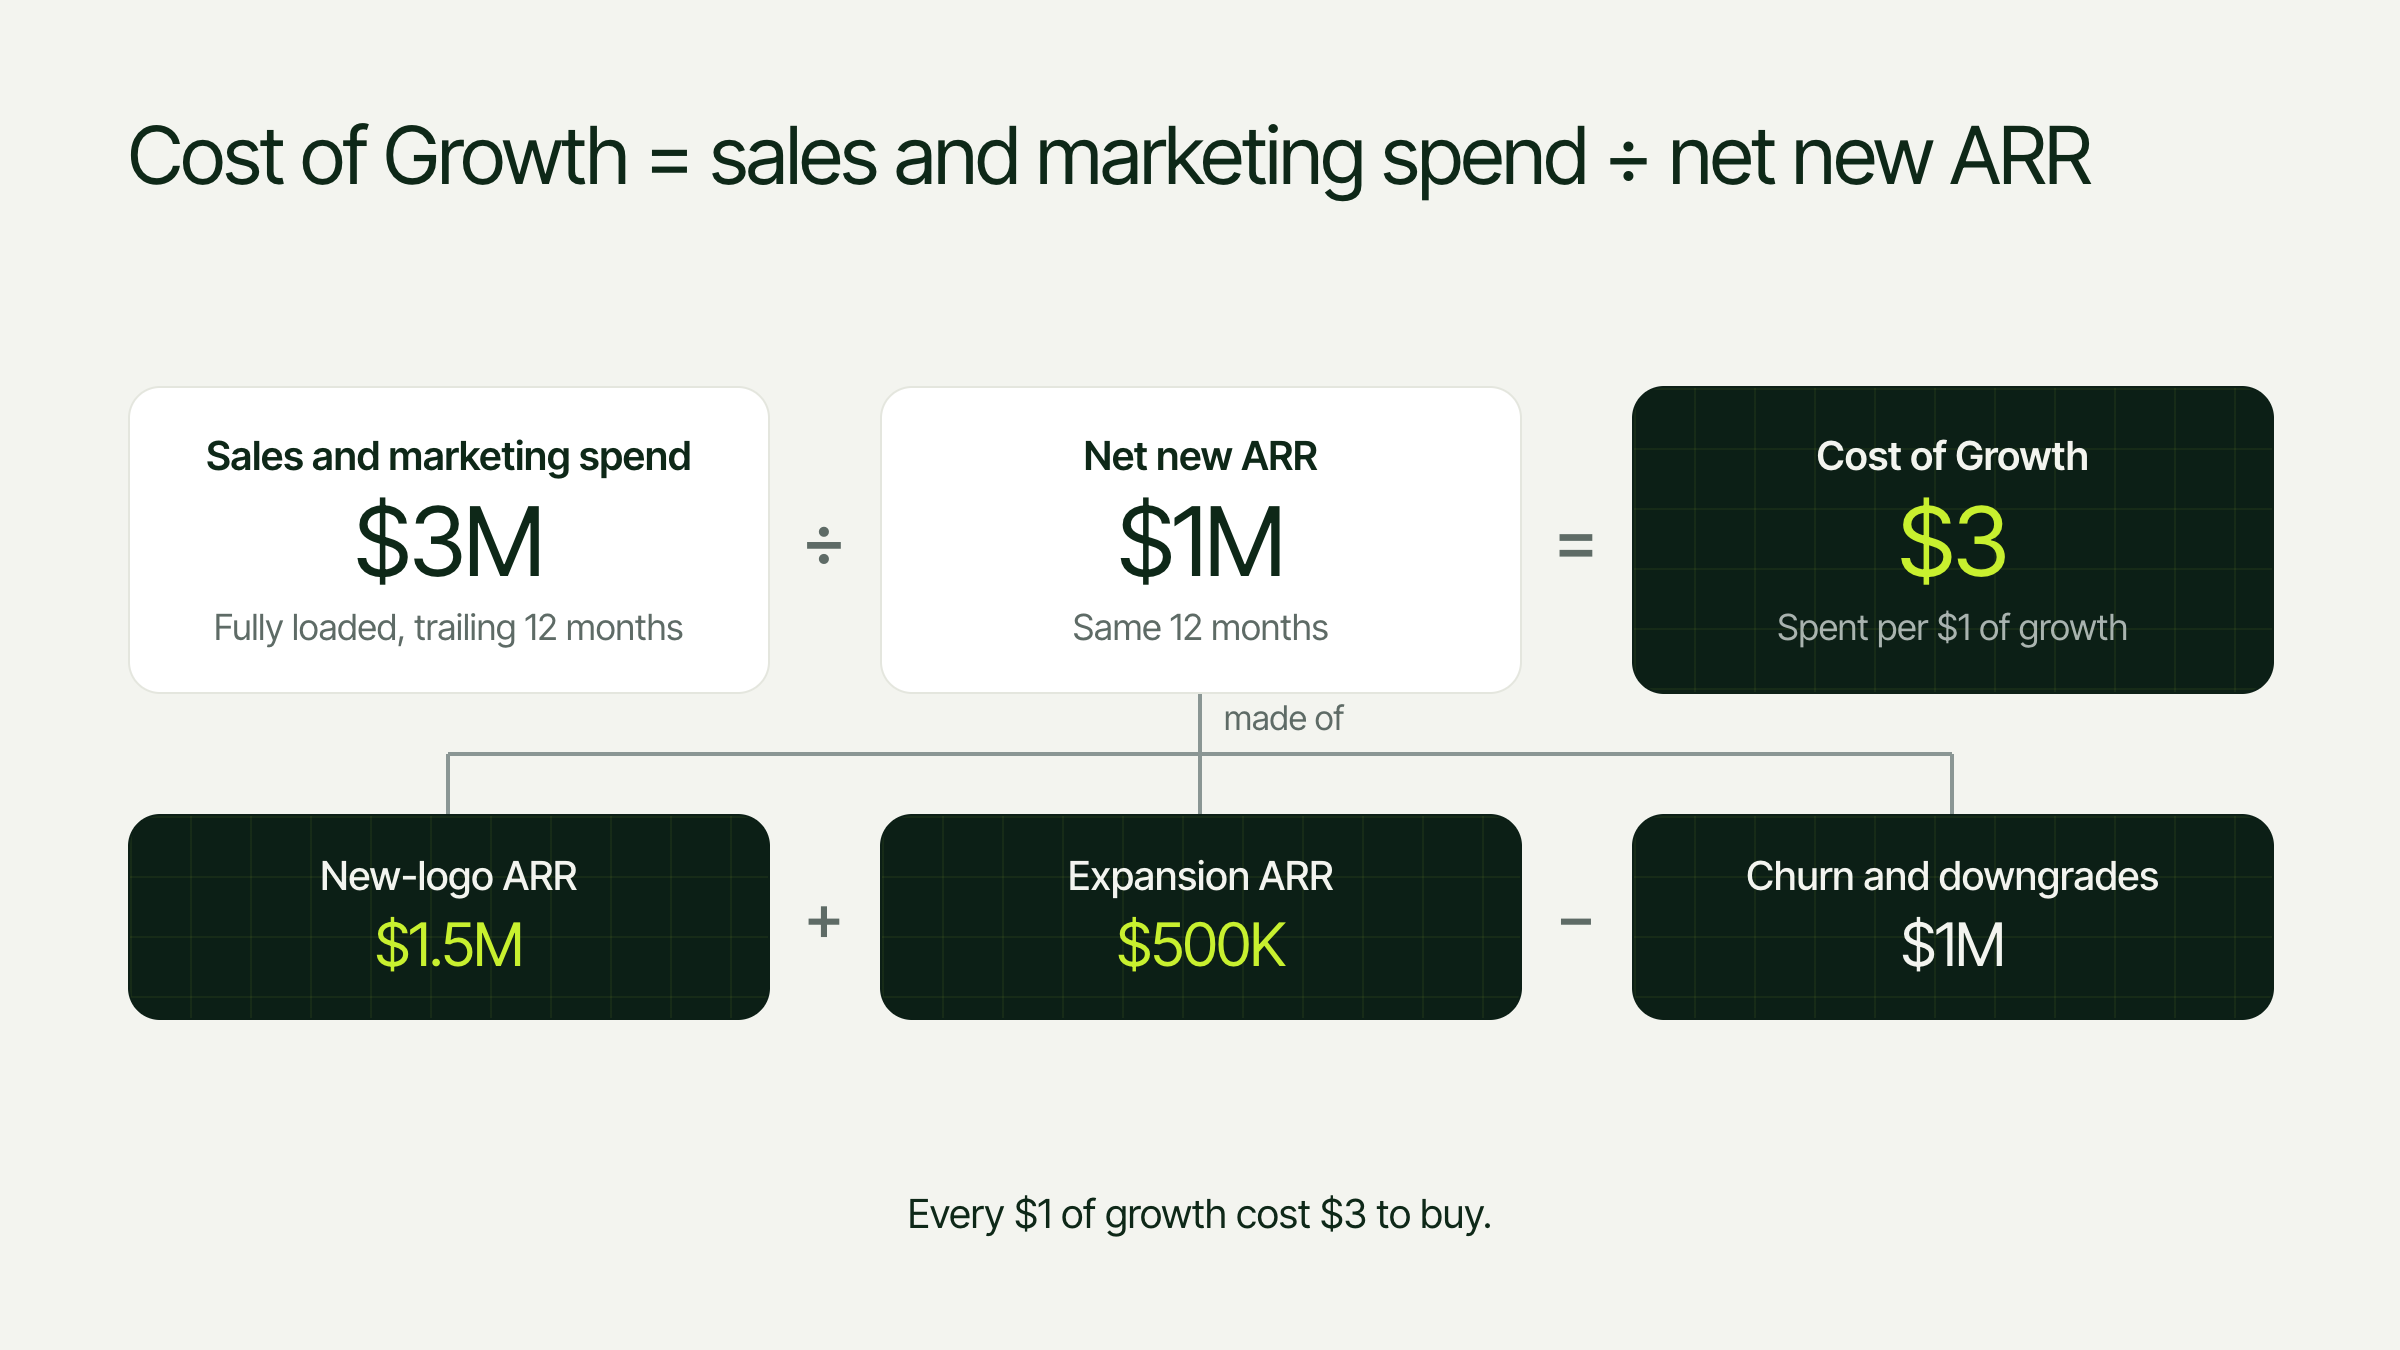
Net new ARR equals new-logo ARR plus expansion ARR minus churned and downgraded ARR.
Net new ARR is new-logo ARR plus expansion ARR, minus churned and downgraded ARR.

Net new ARR is more than just new revenue. It's the new business you signed, plus what existing customers expanded, minus everything you lost to churn and downgrades. So if you spent $3 million on sales and marketing over the last 12 months and added $1 million in net new ARR, your Cost of Growth is $3, meaning every dollar of growth cost you three dollars to buy.

Illustrative example of Cost of Growth: $3M in trailing 12-month sales and marketing spend divided by $1M in net new ARR equals $3 spent per $1 of growth. Net new ARR is $1.5M new-logo ARR plus $500K expansion ARR minus $1M in churn and downgrades.
Illustrative example: $3M in sales and marketing spend divided by $1M in net new ARR gives a Cost of Growth of $3.

For context, the median public SaaS company spends $2.34 to add $1 of net new ARR, according to David Spitz at BenchSights, up from $1.24 in 2021. At Passetto, we regularly see companies at $3, even $4, and their growth rate is usually dropping at the same time.

Line chart of median Cost of Growth at public SaaS companies. It rose from $1.24 in 2021 to $2.09 in 2023, held near $2 through Q1 2025, then climbed to $2.31 in Q3 2025 and $2.34 in Q2 2026.
Median sales and marketing spend per $1 of net new ARR at public SaaS companies, 2021 to Q2 2026.

Why Cost of Growth / GTM Efficiency matters for marketing

Sophisticated finance teams usually already measure Cost of Growth, often without marketing at the table, and that's what they use to decide which budgets stay and which get cut. But that's typically where it stops. They make the call off the top-line number, so when it's high, the next step is usually to scrutinize spend by department, and it's common for marketing or sales to simply get cut by a set percentage instead of anyone going deeper to find where the problem actually is and identify where the efficiency is eroding.

That's a real risk for marketing, because a blanket cut can take out the programs that are actually working. It also means marketing can end up taking the blame for a problem that lives somewhere else entirely, like a sales cycle that's gotten too expensive or churn that's eating into growth (which is extremely common).

The most common financial metrics marketers rely on, like CAC, ROAS, ROI, cost per MQL and marketing-sourced pipeline ratio, all share the same limitations. They're really different approaches to the same goal: measuring how efficiently a marketing dollar is being spent, or what it returns. But each one only looks at a slice of the picture, and they're also rarely fully loaded with agency fees, headcount and software costs, and most importantly, none of them will tell you where your budget is bloated relative to the commercial outcomes it's producing.

Breaking it down by objective

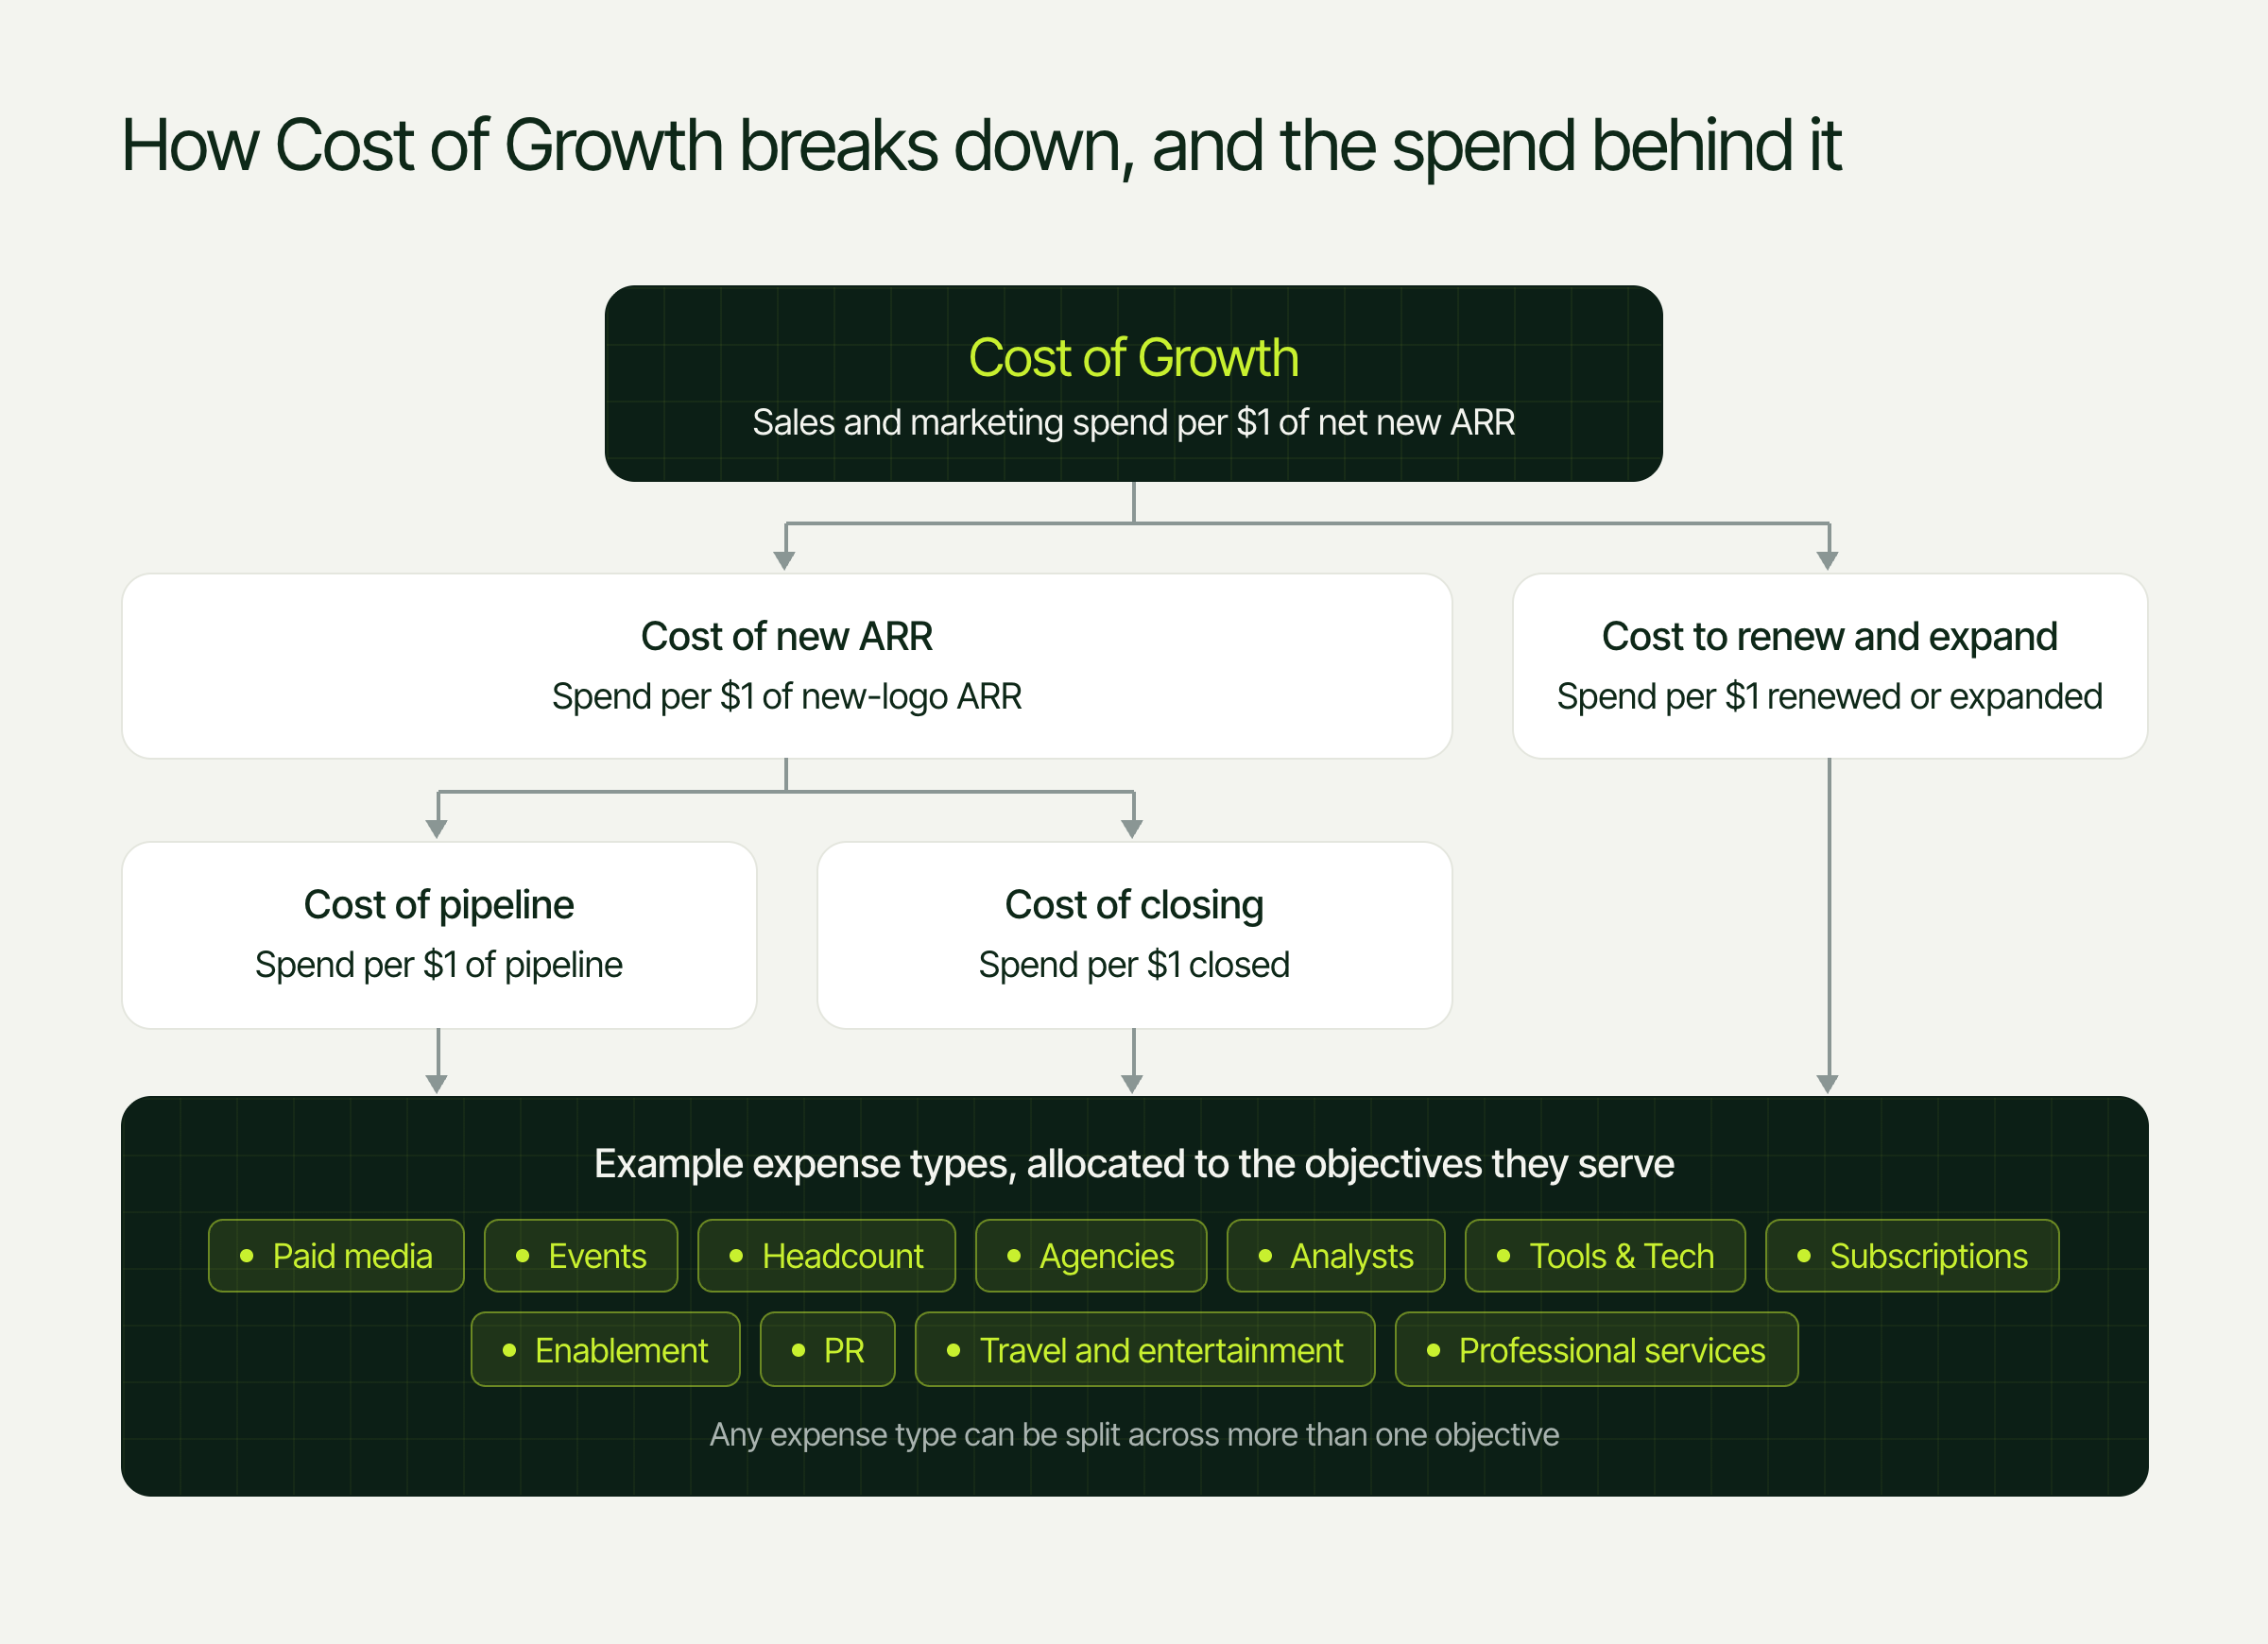
The real value of Cost of Growth comes from what happens after the top-line number is calculated. Every GTM dollar serves at least one of three objectives: creating pipeline, closing new business, or renewing and expanding existing customers. When you allocate your spend to those objectives, splitting anything that serves more than one, Cost of Growth breaks down into two parts, and the first of those breaks down again:

  • Cost of new ARR is how much you spend to win $1 of new-logo revenue, and it's made up of:
    • Cost of pipeline: what you spend to create $1 of pipeline
    • Cost of closing: what you spend in the sales cycle to close $1 of new business
  • Cost to renew and expand is how much you spend to keep and grow $1 of existing revenue.
Cost of Growth, sales and marketing spend per $1 of net new ARR, splits into cost of new ARR and cost to renew and expand. Cost of new ARR splits further into cost of pipeline and cost of closing. All of them draw on example expense types such as paid media, events, headcount, agencies, analysts and tools, and any expense type can be split across more than one objective.
How Cost of Growth breaks down, and the spend behind it.

Once every expense is tagged to the objective it serves, you end up with a clear view of where your budget is going, what each dollar is returning, and which way each objective is trending from one period to the next.

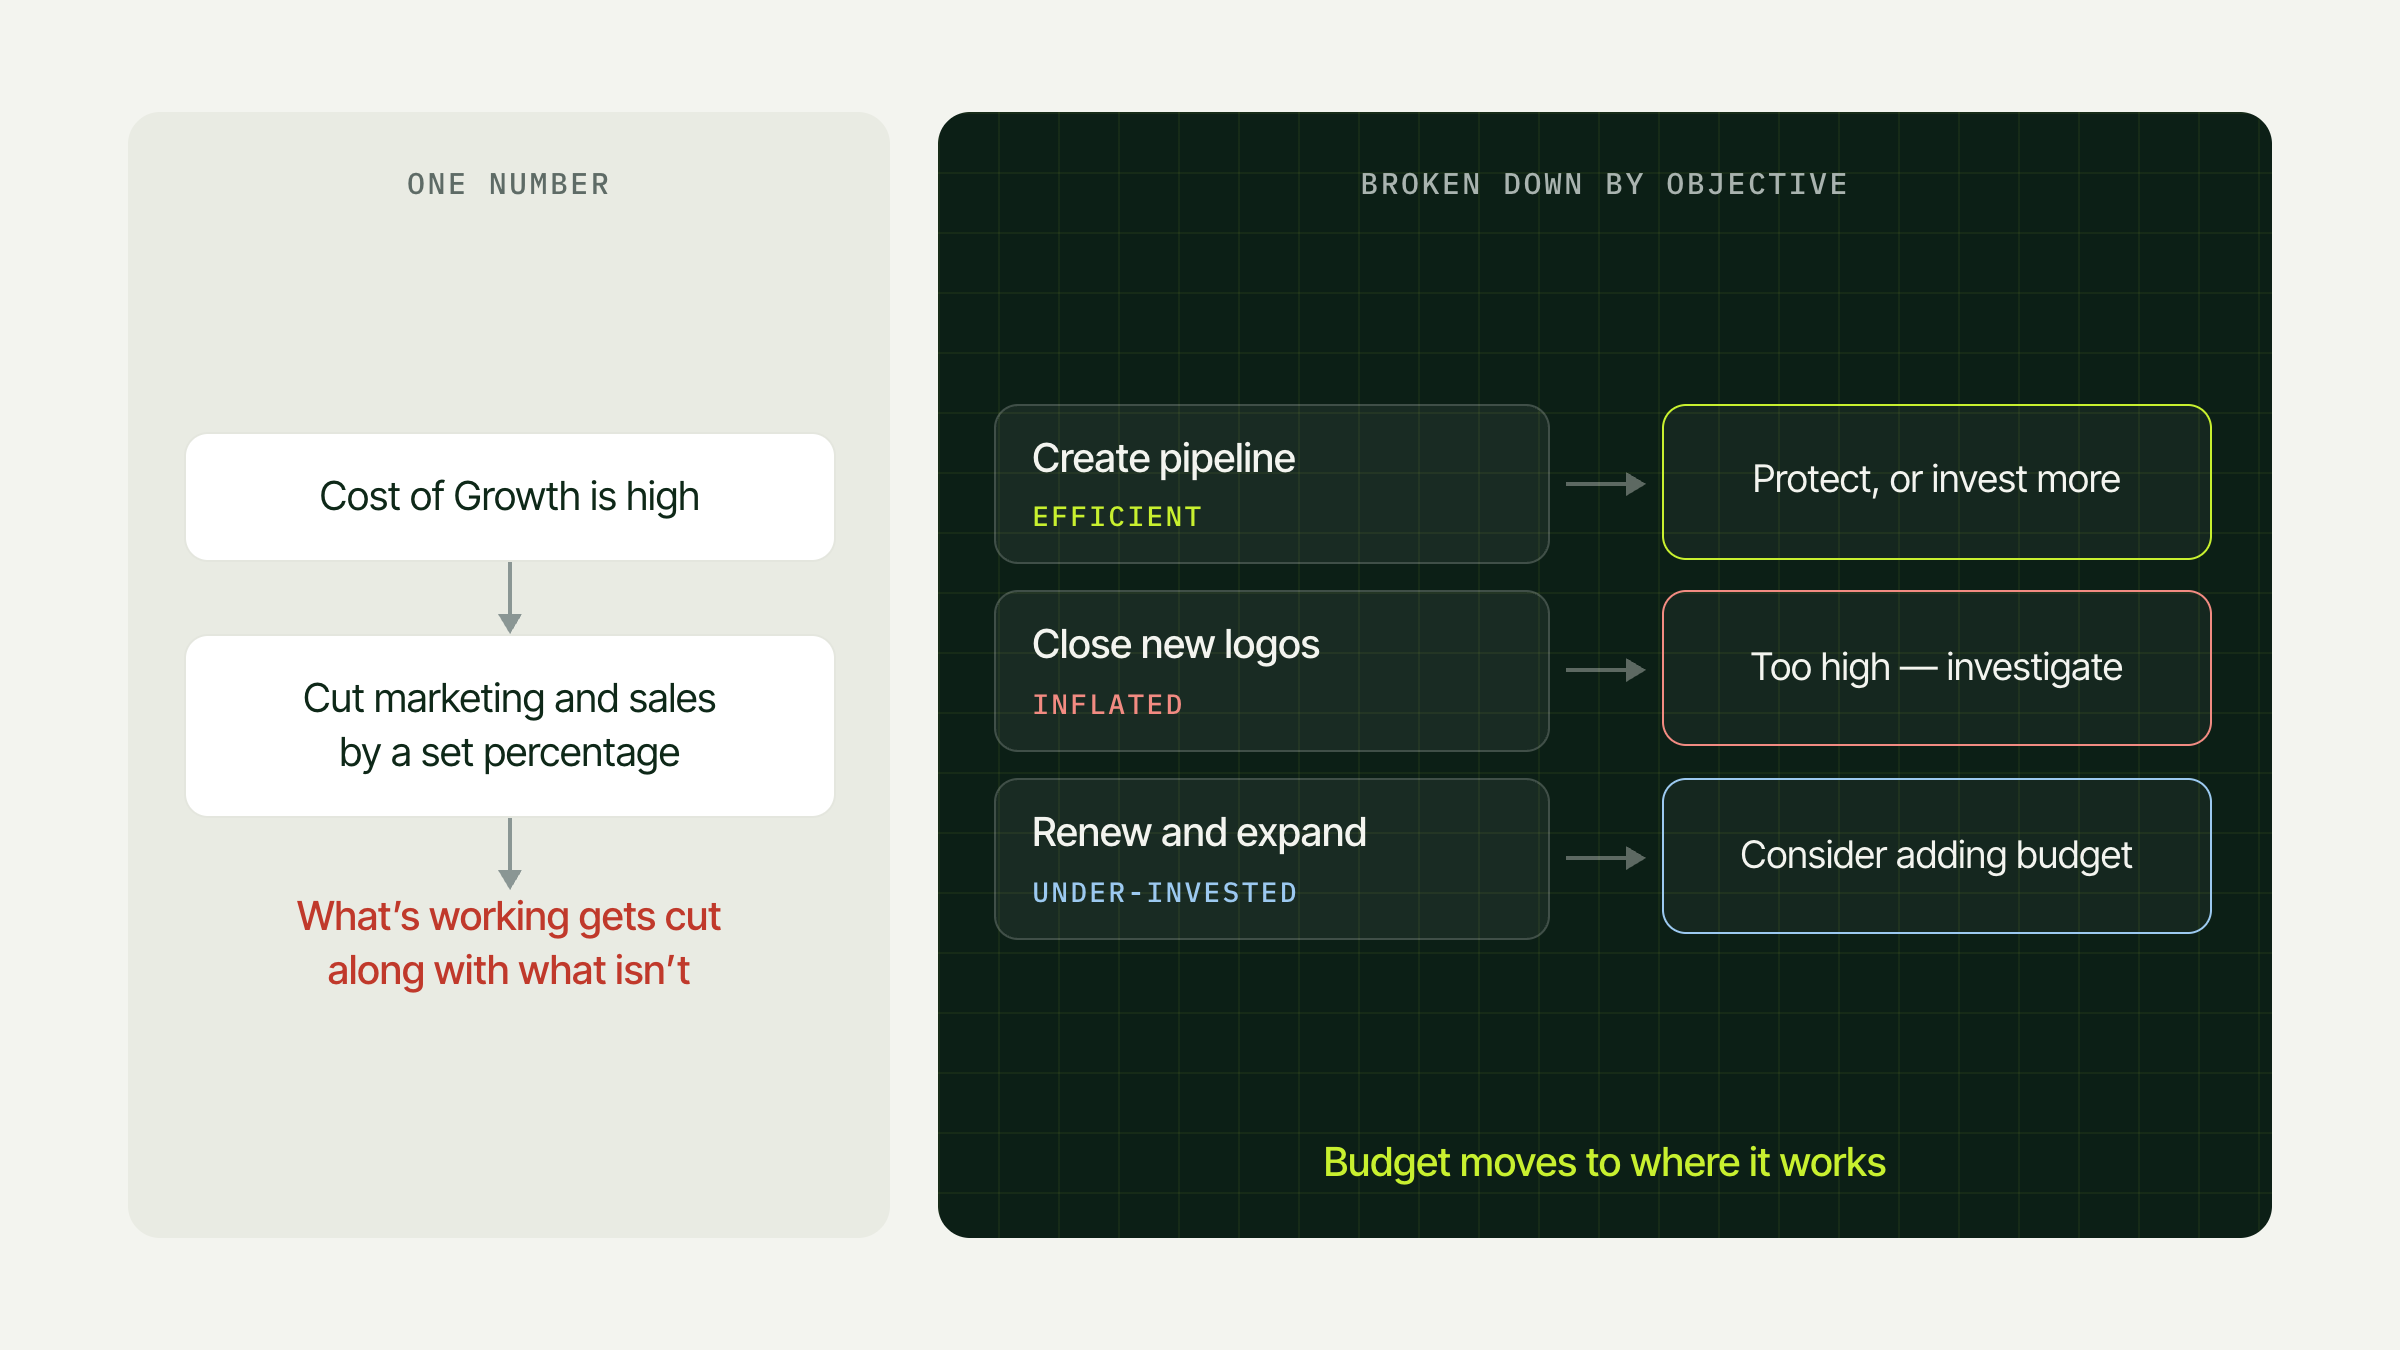
Rather than one high number and a blanket cut, you get something you can act on: which objective is over-invested, which one might deserve more budget, and exactly where to dig in further.

Comparison of two responses to a high Cost of Growth. On the left, treating it as one number leads to cutting marketing and sales by a set percentage, so what's working gets cut along with what isn't. On the right, it's broken down by objective: create pipeline is efficient (protect, or invest more), close new logos is inflated (too high, investigate), and renew and expand is under-invested (consider adding budget). Budget moves to where it works.
A blanket cut vs. a decision made by objective.

That's what makes the waste visible. What we commonly see at Passetto is that Cost of Growth is high overall, but when you break it down, the inefficiency is concentrated in one area. One way that can show up is cost of pipeline, which is where marketing spends most of its budget, looking healthy while cost of closing is inflated, meaning the company is spending too much in the sales cycle to close new business relative to what it's getting back. That doesn't tell you the cause on its own, but it gives you a specific area to dig into further, whether that turns out to be a pipeline problem, a sales performance issue or something else.

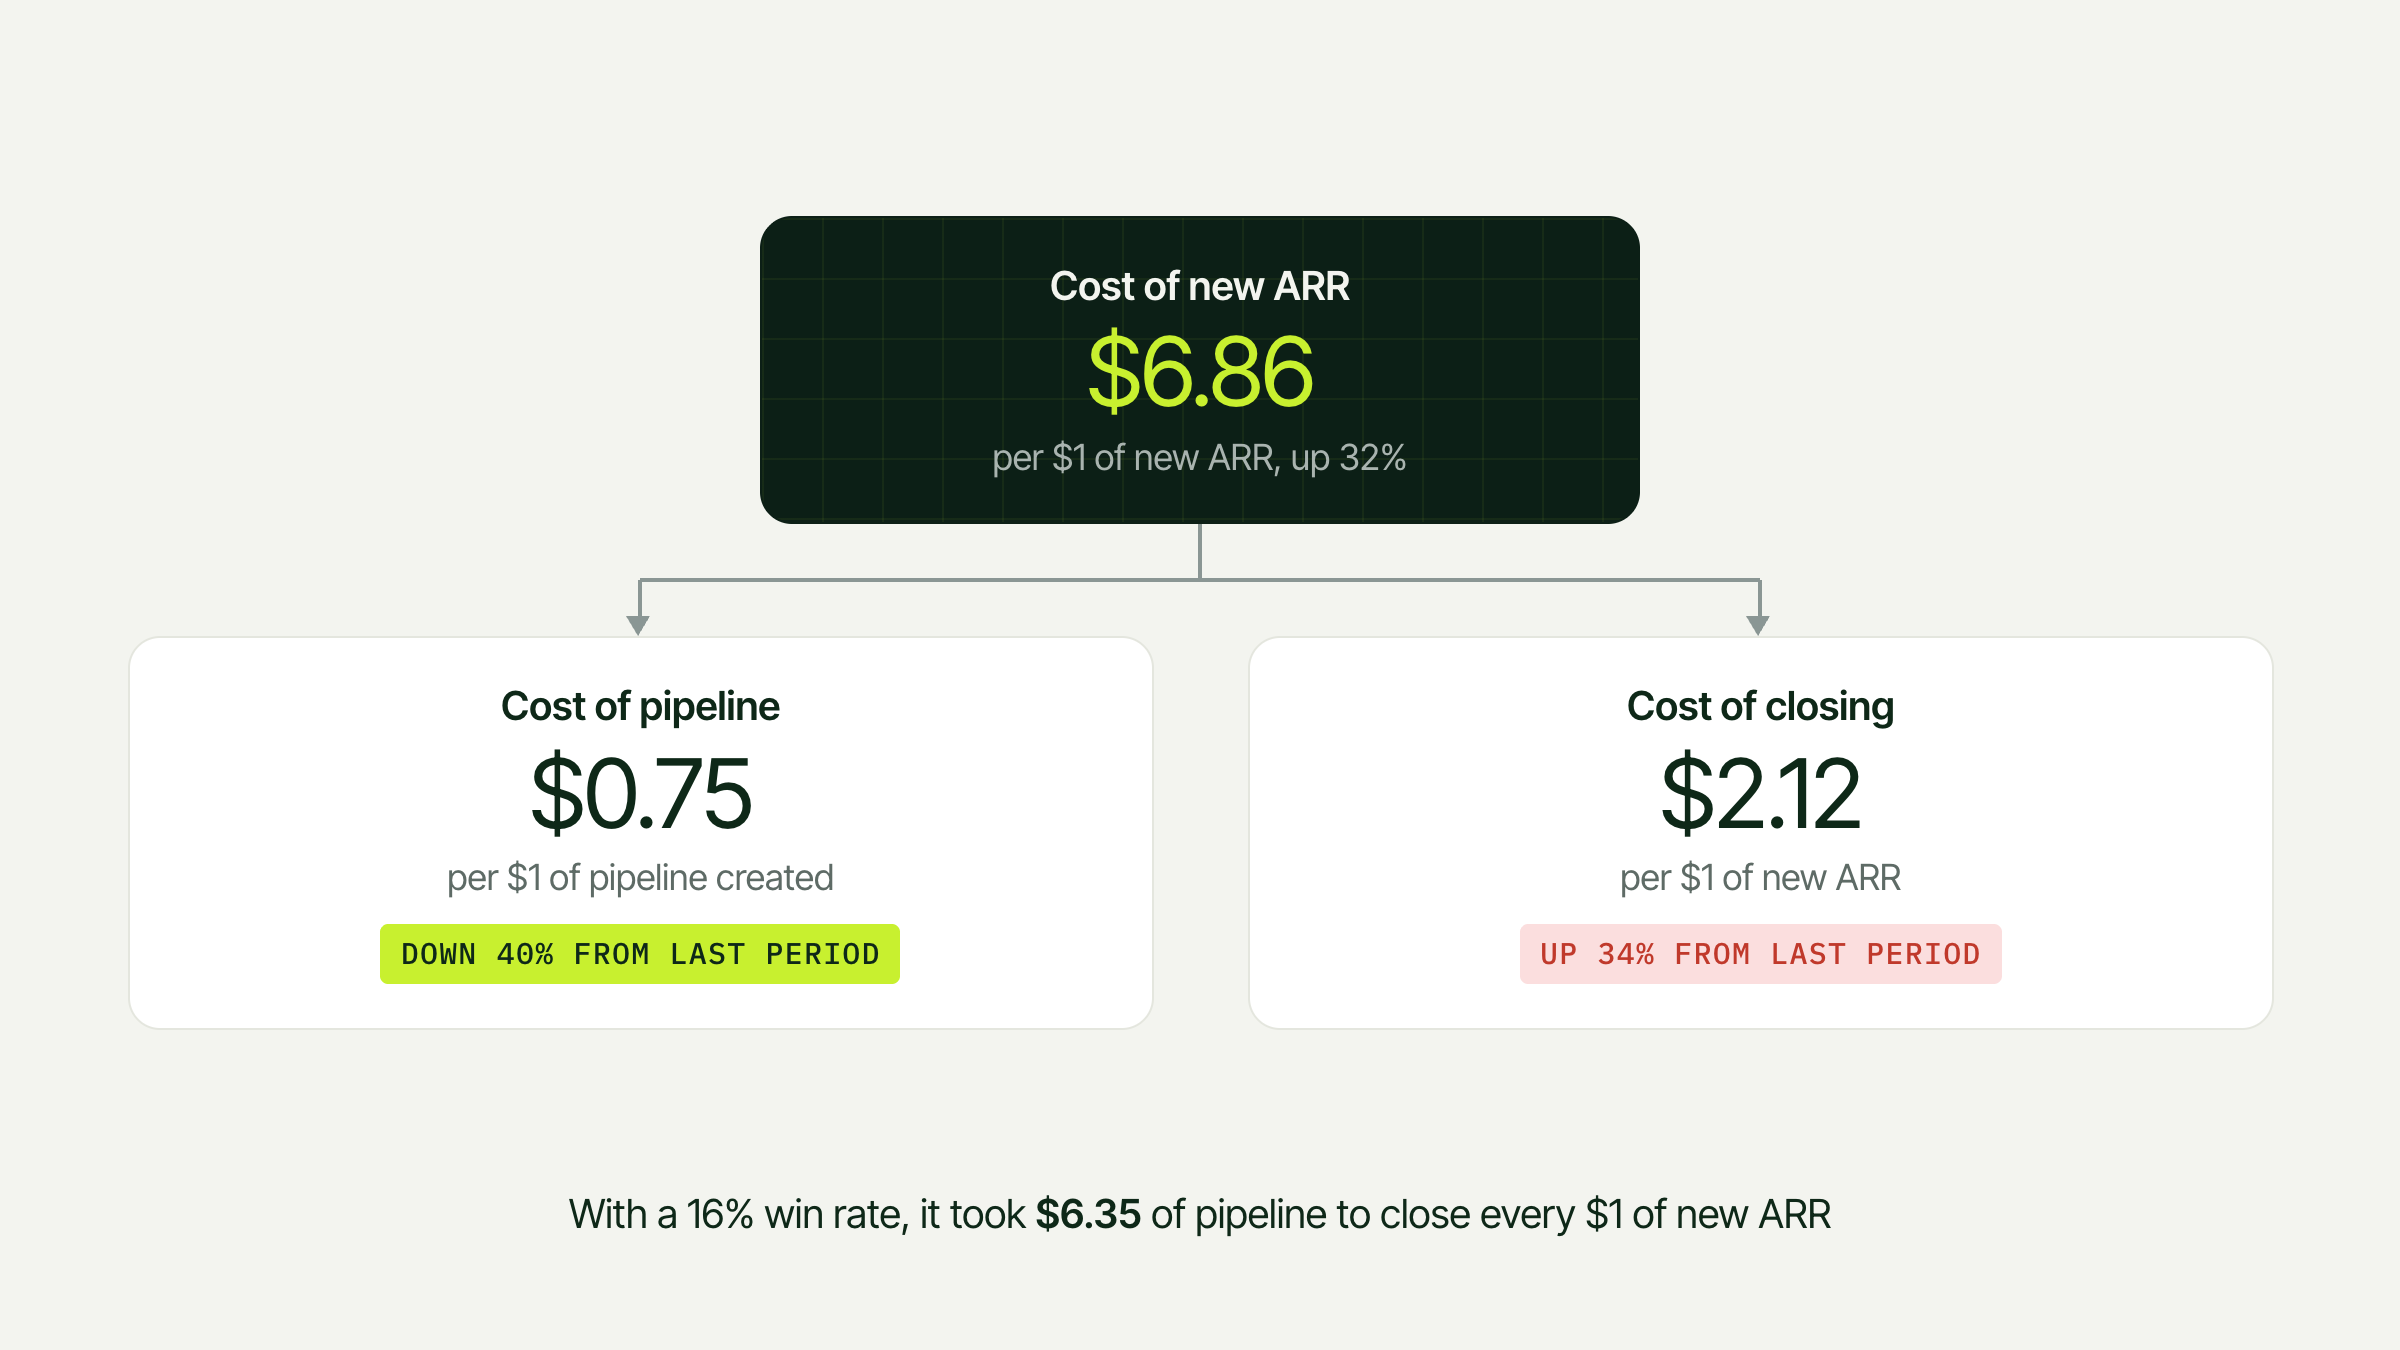
At one company we work with, it was costing $6.86 to win every $1 of new logo ARR. The spend to create pipeline had actually gotten 40% more efficient year-over-year, but closing costs were up 34% and only about 16% of opportunities were being won. Without the breakdown, all leadership would have seen was one number going the wrong way, and marketing's budget would have been the easiest place to cut.

Illustrative example. Cost of new ARR is $6.86 per $1 of new ARR, up 32%. It splits into cost of pipeline at $0.75 per $1 of pipeline created, down 40%, and cost of closing at $2.12 per $1 of new ARR, up 34%. With a 16% win rate, it took $6.35 of pipeline to close every $1 of new ARR.
Illustrative example: cost of new ARR rose to $6.86 per $1. Cost of pipeline fell 40%, but cost of closing rose 34%.

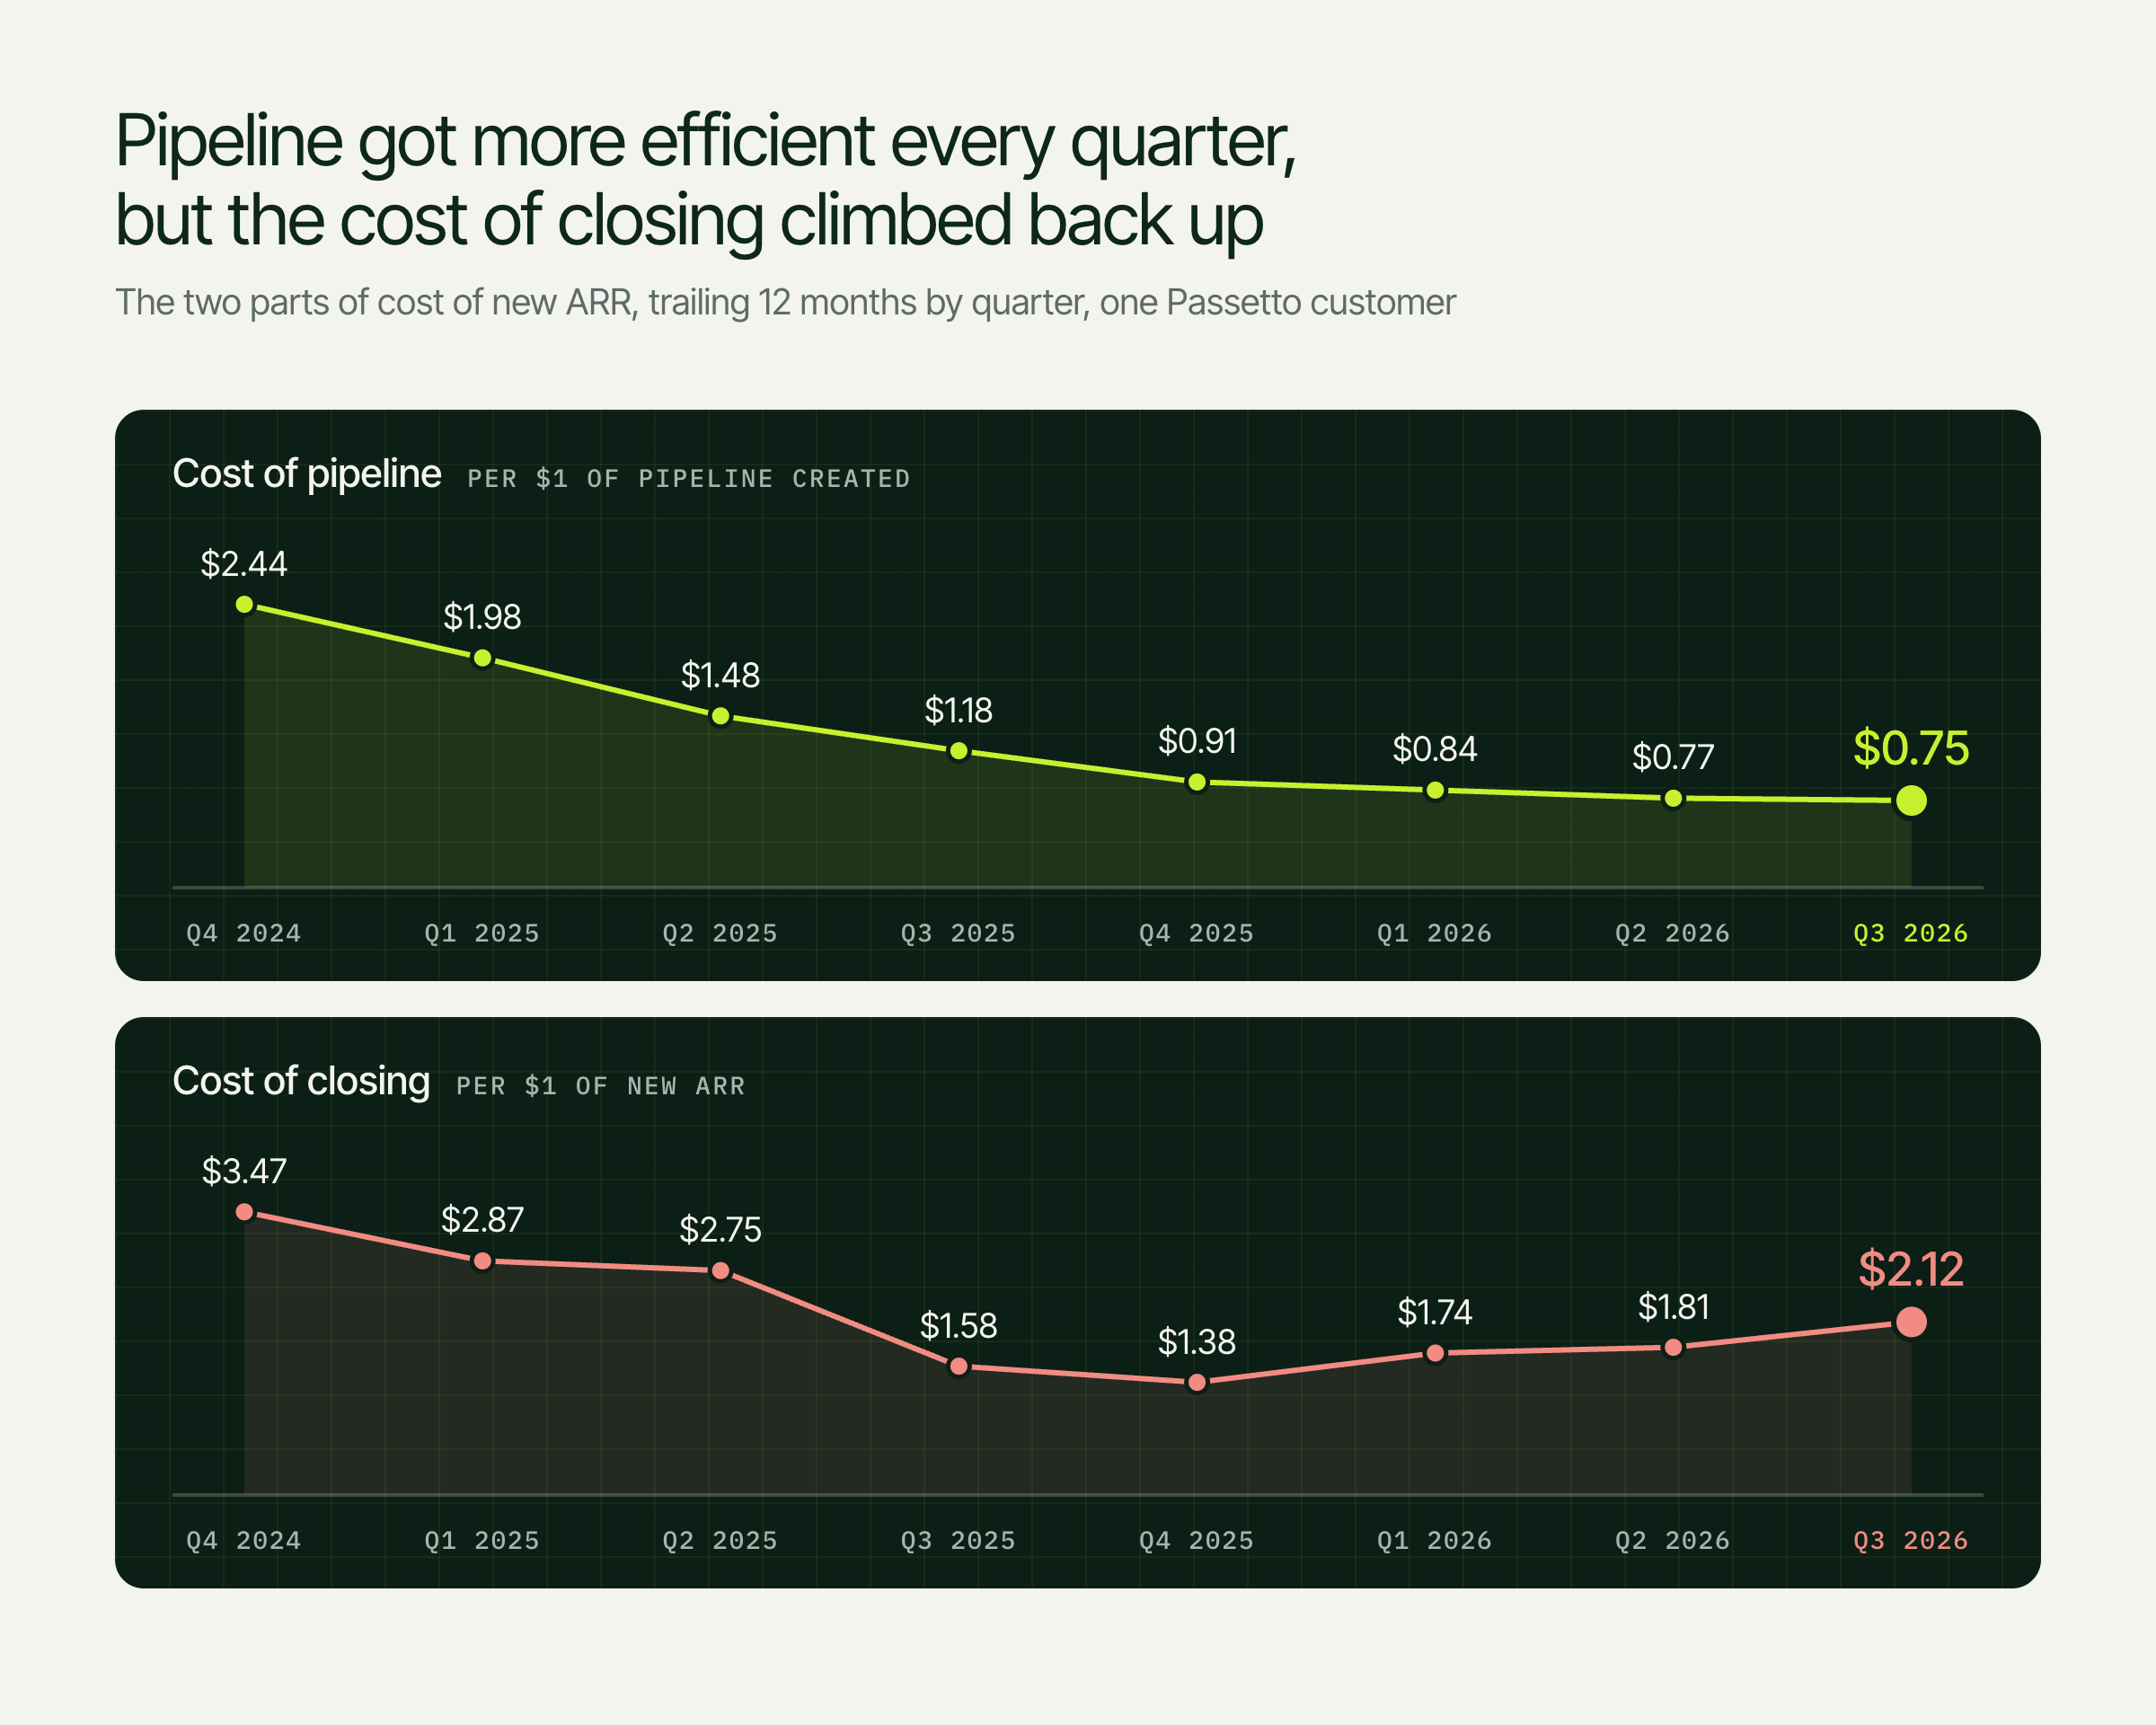
Looking at the two parts of that company's cost of new ARR over time makes the pattern even clearer. Their cost of pipeline came down every single quarter, from about $2.44 to $0.75, while their cost of closing bottomed out at $1.38 and then climbed back to $2.12.

Illustrative example. Two line charts, trailing 12 months by quarter. Cost of pipeline fell every quarter, from $2.44 per $1 of pipeline created in Q4 2024 to $0.75 in Q3 2026. Cost of closing fell from $3.47 per $1 of new ARR to a low of $1.38 in Q4 2025, then rose to $2.12 by Q3 2026.
Illustrative example: pipeline got more efficient every quarter, while cost of closing dropped through Q4 2025 and then rose again.

From there, you get visibility into how the budget is allocated inside each objective. If cost of closing is the number that's climbing, like in the example above, you can look at exactly what's inside it and see what's driving the increase. In this illustration, headcount makes up 75% of everything spent to close new business, which immediately stands out as the first place to investigate.

Illustrative example. Donut chart of cost-to-close spend by expense type: headcount 75%, travel and entertainment 10%, enablement 6%, events 5%, and tools and tech 4%.
Illustrative example: headcount makes up 75% of Cost to Close spend.

What it means for brand and everything you can't trace

This is one of the core reasons we built Passetto. Our team has deep roots in demand generation, where we've always advocated for running programs that reach the 95% of the market that isn't ready to buy yet, through things like brand awareness plays, events and field experiences, PR and dark social. Those programs build awareness, trust and preference, but they don't produce leads that click and convert right away, and they rarely tie back to a specific channel, which makes them the first spend a CFO questions.

The instinct is to obsess over attribution by attempting to track more touches and draw a line from every channel to every deal, but that line never fully holds, and every assumption in the model is one more thing for a CFO to poke holes in.

The better, easier and more defensible move is to look at spend efficiency instead. Start with your overall Cost of Growth to see whether spend is healthy or inflated, then look at the objective your brand spend serves. If those numbers look healthy, that's a strong sign your brand investments are doing their job, even if you can't tie them to a specific deal, and it gives you a far stronger answer for your CFO than any attribution model will.

Where to start

Calculating the top-line Cost of Growth number is straightforward: take your trailing 12 months of fully loaded sales and marketing spend and divide it by net new ARR over the same period. Ideally you get the full number from finance, but you can start with marketing spend alone and still learn a lot.

If you don't have visibility into churn and downgrades, which is common for marketing teams, you can start even simpler with Cost of New ARR. Take the spend tied to winning new business and divide it by new-logo ARR over the same period. That skips the net losses entirely and still gives you a clear read on how efficiently your spend is turning into new revenue.

Going one level deeper, to split cost of new ARR into Cost of Pipeline and Cost of Closing and identify the root causes of under-investment or GTM bloat, takes more work, since every expense has to be rolled up by vendor and allocated across objectives. You can absolutely do it manually in a spreadsheet with some categorization work, and if you'd rather not maintain it by hand, that's where Passetto's tool takes the manual work out of it.

Marketing leaders who measure their Cost of Growth walk into budget conversations with an answer, and with a much stronger case for the spend that's working.